
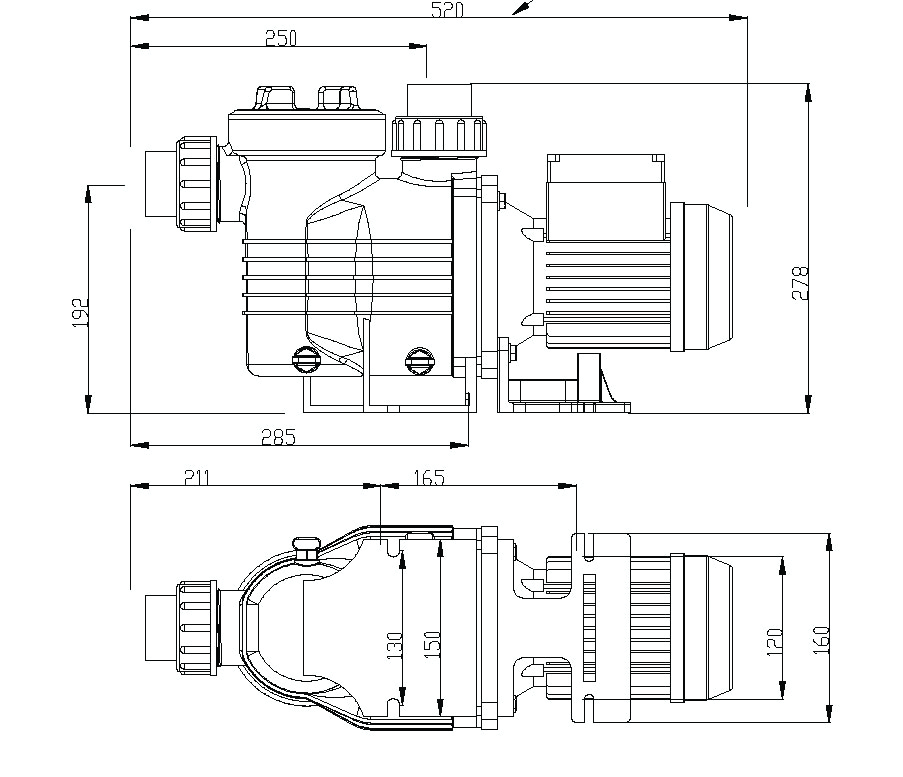
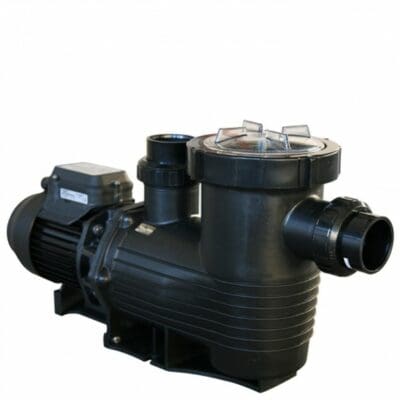
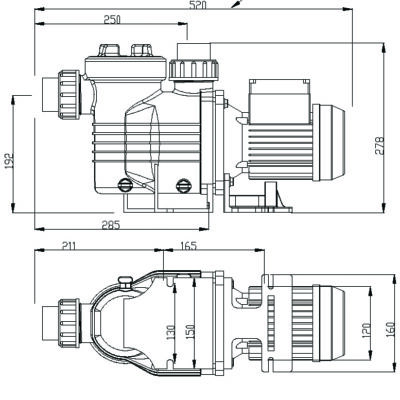
Aquamite - Swimming Pool Pump
The Aquamite is a compact pump ideal for domestic swimming pools and small recirculation systems including ponds and water features
Situated between the pump wet end & the pump motor, a mechanical seal forms a seal around the motor shaft to prevent water from running out along the shaft of the motor.
Waterco’s patented Secondary Seal technology protects the pump motor’s end shield from any water contact, by capturing any leaks through a worn-out mechanical seal and draining it out of the pump.
Waterco’s Aquamite Pumps are tested and certified by TÜV Rheinland. TÜV Rheinland is a government authorised testing organisation that awards the GS mark, and is respected worldwide for its strict evaluation criteria and high technical standards. TUV marks, in general, are a sign of documented, objective third-party proof of features or performance of the products, systems, installations and services.
Prices
| Code | Description | Price | |
|---|---|---|---|
| 1540-X | 0.33 Hp Aquamite Pump | (2402033EUM) | £495.34 |
| 1541-X | 0.50 Hp Aquamite Pump | (2402050EUM) | £519.73 |
| 1542-X | 0.75 Hp Aquamite Pump | (2402075EUM) | £537.60 |
| 1543-X | 1.00Hp Aquamite Pump | (2402100EUM) | £578.96 |
| 1544-X | 1.25 Hp Aquamite Pump | (2402125EUM) | £584.71 |
All Prices are excluding VAT
Pump Supplied with quick connect unions
Warranty
- 3 years wet end
- 2 Years Motor
- 1 Year Mechanical seal
Not Applicable on saltwater pool.
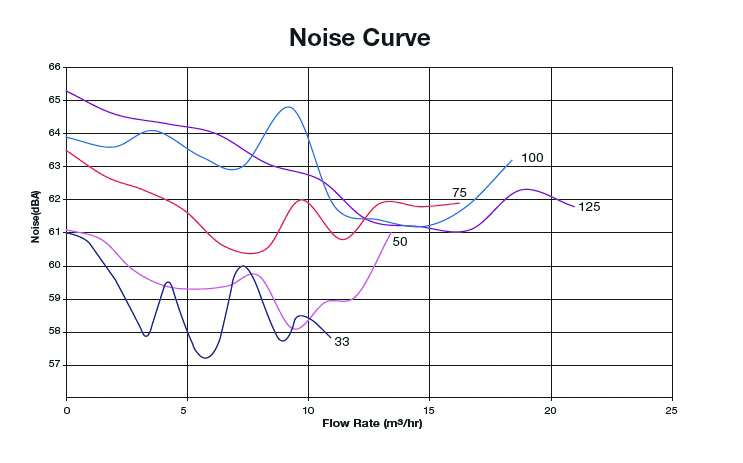
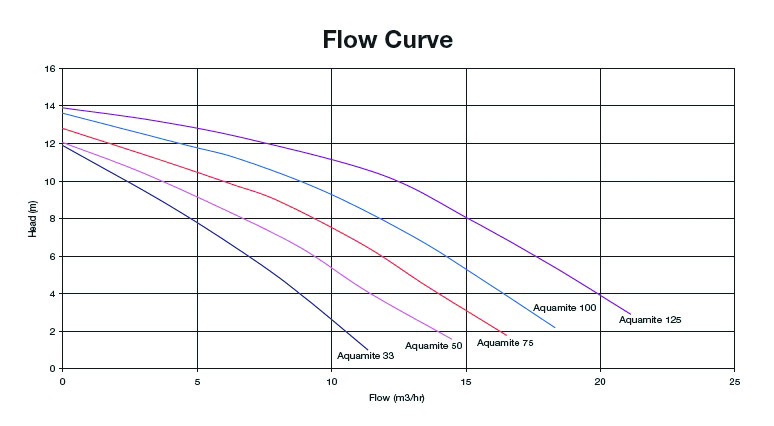
Performance
| Model | HP | Pmax Kw | Amps | Phase | Total Length mm | Motor Frame | Flow Rate @ 1-3m |
|---|---|---|---|---|---|---|---|
| 2402033 | 0.33 | 0.53 | 2.30 | 1 | 497 | 63 | 11.3m3/hr |
| 2402050 | 0.50 | 0.58 | 2.50 | 1 | 497 | 63 | 14.4m3/hr |
| 2402075 | 0.75 | 0.65 | 3.00 | 1 | 497 | 63 | 16.8m3/hr |
| 2402100 | 1.00 | 0.76 | 3.33 | 1 | 497 | 71 | 19.8m3/hr |
| 2402125 | 1.50 | 0.88 | 3.90 | 1 | 497 | 71 | 22.2m3/hr |