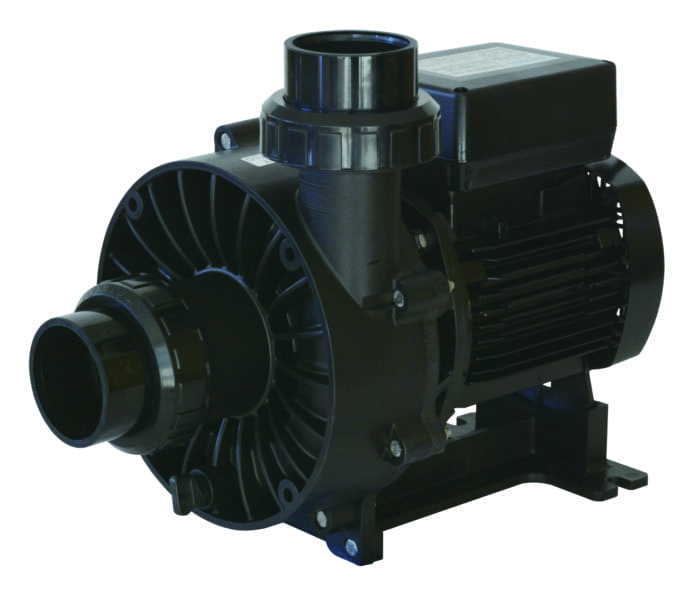
Waterco - TurboFlo Spa Pump
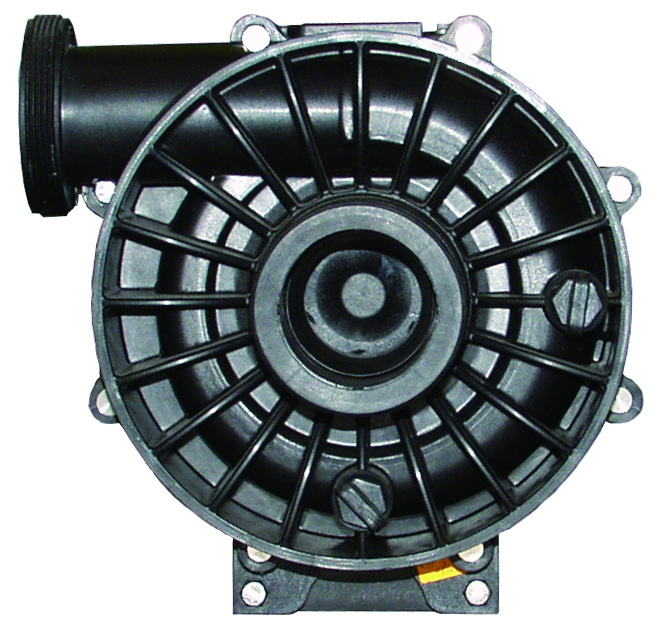
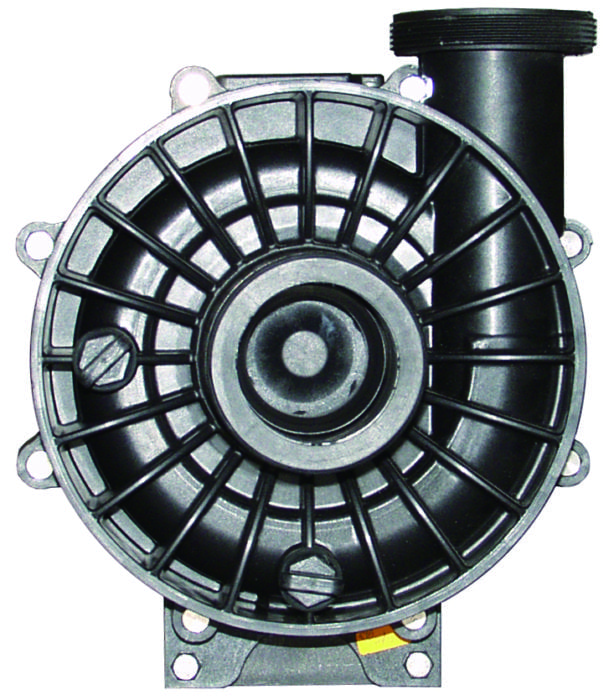
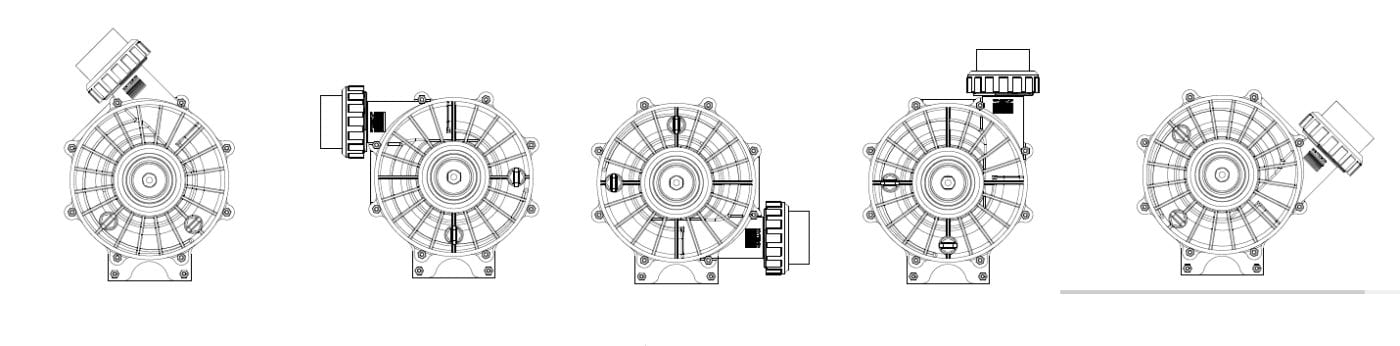
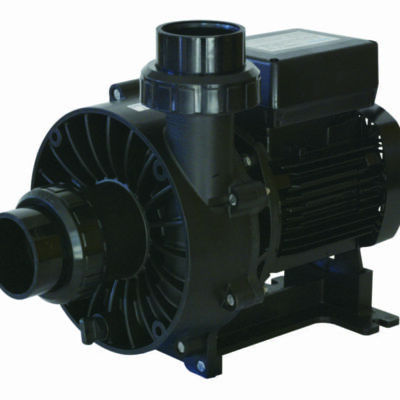
TurboFlo is a hydraulically efficient, high performance pump designed for pools and spas with high power requirements. It has an adjustable wet end which can be configured to suit up to five different plumbing conditions.
Waterco’s Turbo Spa Pumps are tested and certified by TÜV Rheinland. TÜV Rheinland is a government authorised testing organisation that awards the GS mark, and is respected worldwide for its strict evaluation criteria and high technical standards. TUV marks, in general, are a sign of documented, objective third-party proof of features or performance of the products, systems, installations and services.
Elevate your pool and spa experience with TurboFlo pumps, a cornerstone of top-tier swimming equipment supplies.
Prices
| Code | Description | Price | |
|---|---|---|---|
| 1554-X | 1.00hp Turboflow -100 Spa Pump | (2462100EUM) | £740.34 |
| 1555-X | 1.25hp Turboflow -125 Spa Pump | (2462125EUM) | £764.24 |
| 1556-X | 1.50hp Turboflow -150 Spa Pump | (2462150EUM) | £812.05 |
| 1557-X | 2.00hp Turboflow -200 Spa Pump | (2462200EUM) | £867.75 |
| 1558-X | 2.50hp Turboflow -250 Spa Pump | (2462250EUM) | £923.45 |
| 1559-X | 3.00hp Turboflow -300 Spa Pump | (2462300EUM) | £1,034.84 |
| 1560-X | 4.00hp Turboflow -400 Spa Pump | (2462400EUM) | £1,259.22 |
All Prices are excluding VAT
Pump Supplied with quick connect unions
Warranty
- 3 years wet end
- 2 Years Motor
- 1 Year Mechanical seal
Not Applicable on saltwater pool.
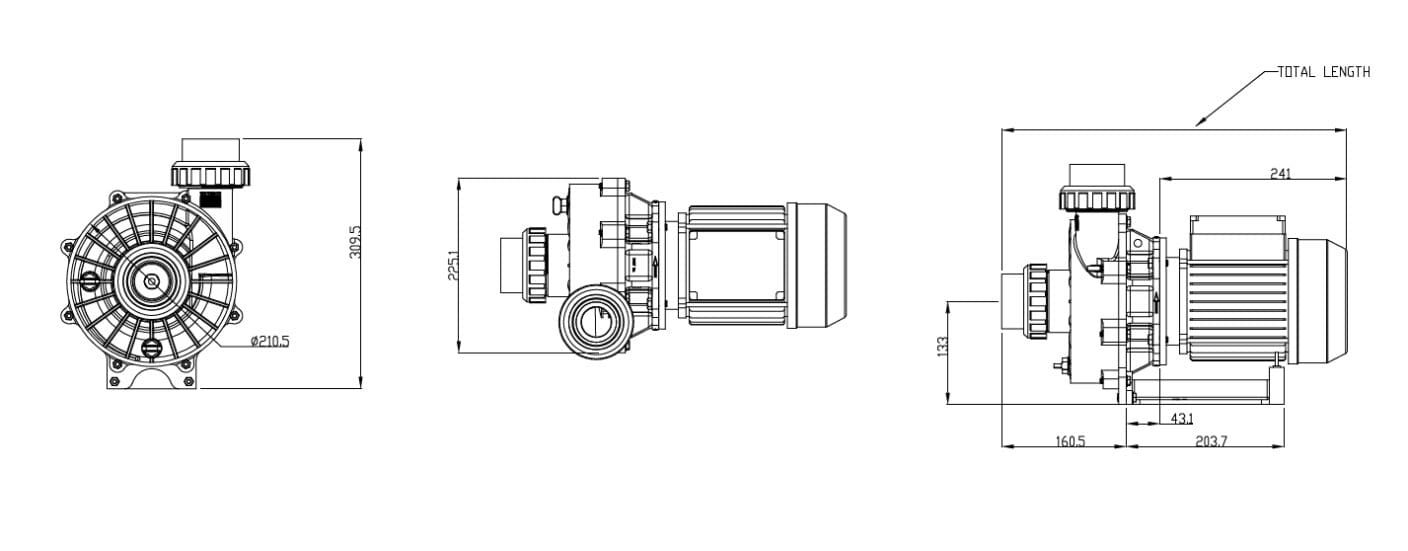
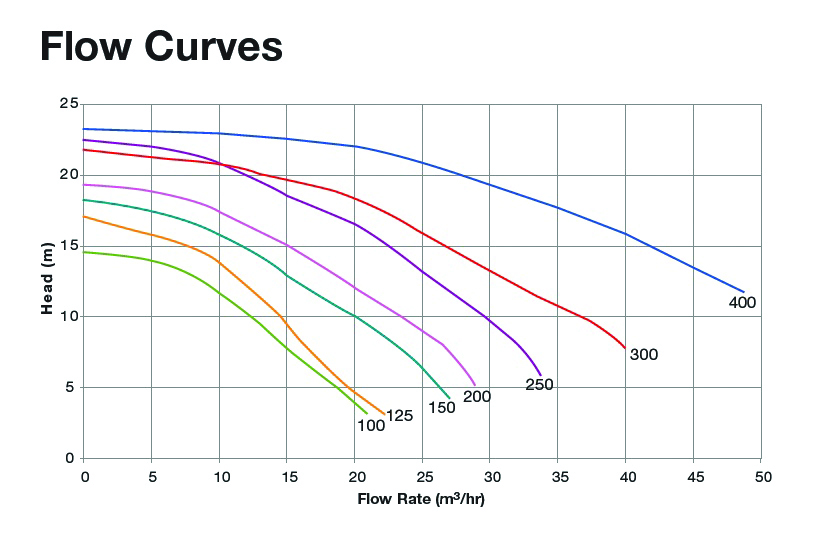
Performance
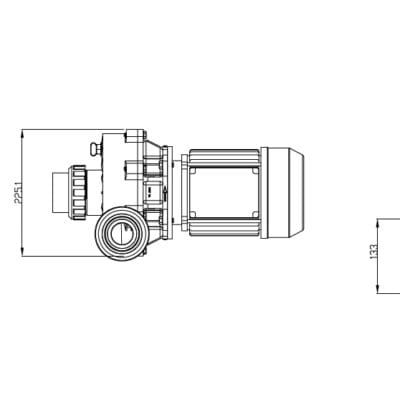
| Model | HP | Pmax Kw | Amps | Phase | Total Length mm | Motor Frame | Flow Rate |
|---|---|---|---|---|---|---|---|
| (2462100EUM) | 1.00 | 0.94 | 4.1 | 1 | 416 | 71 | 21.36m3/hr |
| (2462125EUM) | 1.25 | 1.05 | 4.5 | 1 | 416 | 71 | 22.44m3/hr |
| (2462150EUM) | 1.50 | 1.40 | 5.9 | 1 | 445 | 80 | 27.06m3/hr |
| 24062200EUM | 2.00 | 1.50 | 6.4 | 1 | 445 | 80 | 29.04m3/hr |
| (2462250EUM) | 2.50 | 1.70 | 7.2 | 1 | 445 | 80 | 33.30m3/hr |
| (2462300EUM) | 3.00 | 2.10 | 9.1 | 1 | 483 | 80 | 40.02m3/hr |
| (2462400EUM) | 4.00 | 3.10 | 5.7 | 3 | 508 | 100 | 45.36m3/hr |